.svg)
.png)
Statistically, markets care more about what happened in the last three years versus what happened in the 1970s.
The reason for that is the makeup of the market has changed, in the 70s the market was dominated by oil companies, today it’s tech. Those businesses differ in how they are valued.
A higher weighting in one versus the other is going to change the overall valuation of the market. Three years gives the market a decent valuation gauge with a similar sector mix.

Every year the largest thought leaders from the largest big banks and asset management companies release outlooks on the year/years ahead. Yet when you actually look at it they are wrong very frequently, and it’s simply because trying to predict anything 12 months into the future is pretty much impossible.
Stocks are priced as the price yesterday plus a random event, it’s how you get a random walk, and volatility.
How these banks do it is they take today’s financial data (PE ratios, starting yields, earnings, economic data, and various other factors) and compare it to previous financial data then factor in the long-term average return.
So thinking about this in 2022, JPMorgan’s Long-Term Capital Markets Assumptions stated that 2022 would show a ~4.5% return because yields started low, valuations were still high (compared to the last three years, which includes 2019), and corporate earnings and margins were at all-time highs.
In that scenario, there is much more that can go wrong than there are things that can go right.
In other words, the random events could have a greater pull on returns in 2022, and they did.
The historic average return on a 60/40 stock-bond mix is around 8% and the market goes up about 3 out of every 4 years, historically. So in forecasting probabilities, we can come to conclusions such as we are starting lower, therefore, we have a higher chance of having higher than expected returns.
This is also why calendar year returns actually matter. You wouldn’t think they would. Each day is independent of one another, what’s the difference between December 31st and January 1st, 24 hours?
But in markets, people see a new year as an opportunity. You enter the new year with new expectations, and new outlooks.
Dimes flip as the new year rolls over, even if nothing has materially changed. I am not saying that will happen this year, but it is something that happens.
Based on what I just said hopefully you have an understanding of how these outlooks come together.
Basically, we take what historical returns have been and compare our current starting points with prior starting points, and use probabilities.
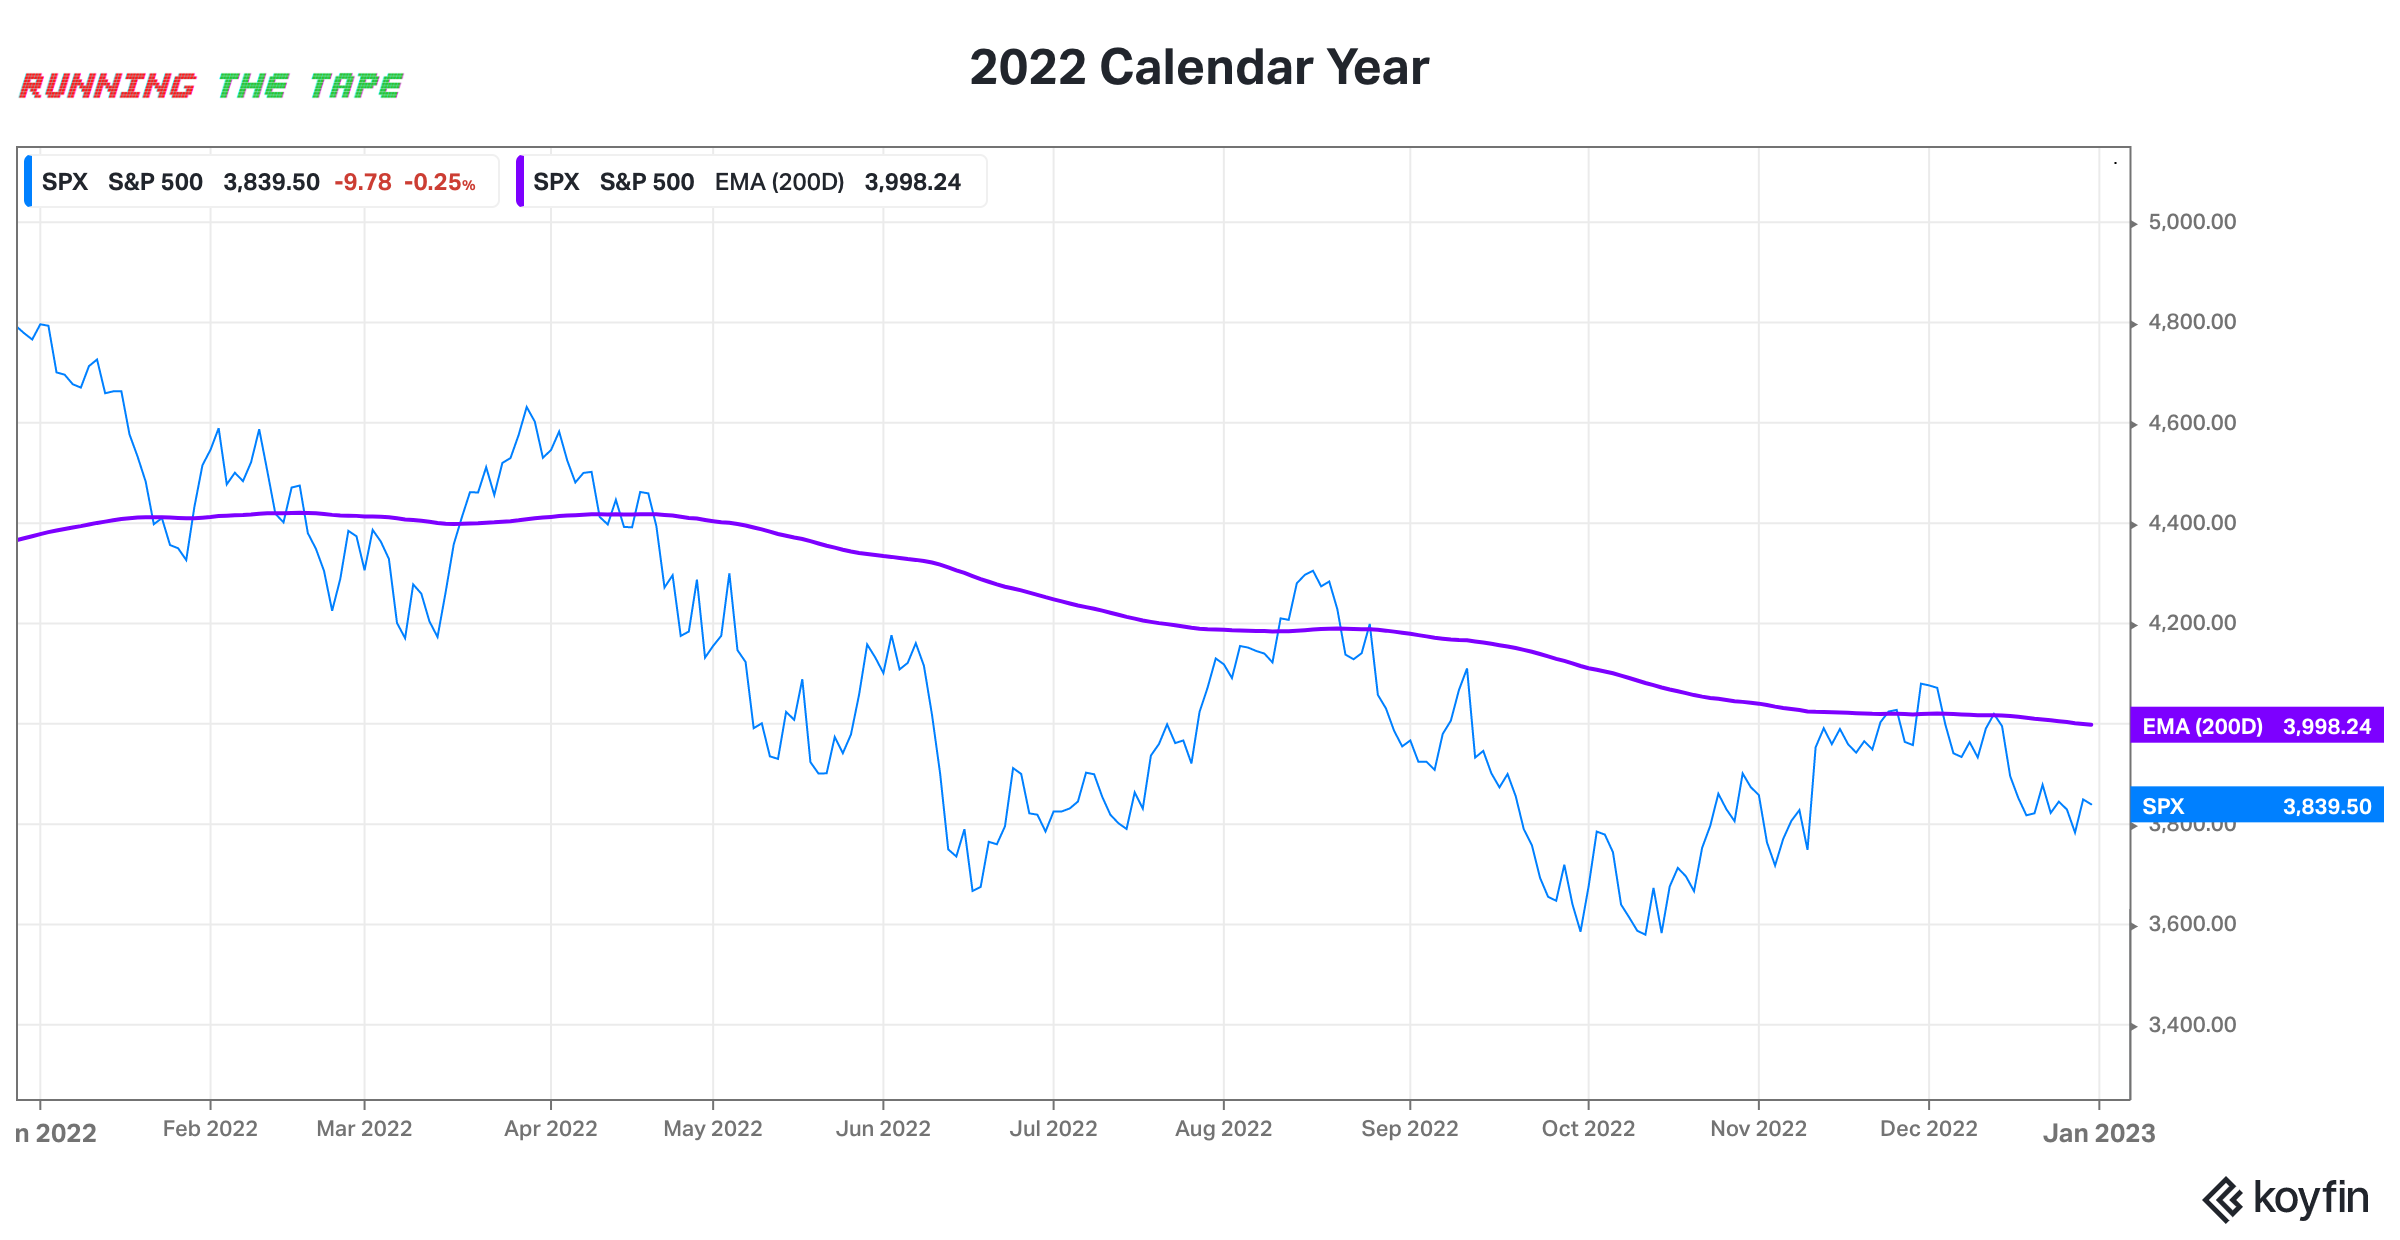
Compared to 2022, 2023 stocks are looking as though they are priced cheap. A $3,800 price seems lower than a $4,800 price.
But we’ve seen the numbers, just because the price has fallen doesn’t mean things are “cheap”. I am talking about valuation.
At the beginning of 2022, the value assign to the S&P 500 was about 24 times earnings, meaning you would pay $24 for every $1 of earnings.
In 2023 we started at around 21 times earnings. That 21 times earnings starting valuation is much cheaper than the three-year average of about 25-27 times earnings, though.

That valuation is based on current earnings, however. Forward earnings estimates started to fall in the back half of 2022.
Companies generally beat analyst expectations, however. It was definitely on a decline in 2022, but we still had companies beating analyst expectations. Even if they didn’t the companies themselves may have guided higher future earnings. Analysts heavily rely on forward projections from the companies themselves.
A falling realized earnings decline would bring valuations higher, if prices don’t fall with them, making stocks look far more expensive.
Given the data here, low starting valuations, and a somewhat priced in earnings recessions, the return outlook compared to the average is looking alright. Without giving a number I expect stocks in 2023 to end the year higher. The big banks tend to agree with that, JPMorgan calls for a 7.9% return (still below average) on the S&P 500 (large-cap stocks).
Most people don’t care about bonds. There is not a lot of flash in buying and owning a bond.
You get what you pay for, yield.
When you buy a bond you will either buy it at a premium or you will buy it at a discount, every bond will have the same-ish yield to maturity. If you are buying bonds at a premium it means that you will have more income on that bond than you otherwise would buying a newly issued bond. And if you are buying at a discount it means that you will have less income but more price appreciation.
Bonds always mature at par, say $100. So if you are buying at $105, it will lose $5, but you may have a 1% higher yield. If you are buying at $95, it will gain $5, but you may have a 1% lower yield. Each bond will have a similar return.
Bonds are just math.

You’ve probably never seen a chart as nasty as this one, but the highlighting makes it a bit easier. Stocks and bonds are meant to be negatively correlated, when risk rises people go to bonds pushing bond prices up, and giving a positive return. Five years going back to 1928 have seen this correlation break.
Honestly, there is no reason to expect that the correlation break will continue.
One of the greatest predictors of future returns in fixed income is starting yield. With yields starting around 4% on Treasuries, the fixed-income market is looking far more attractive than it has since 2004. With savers and retirees alike, there is current lower-risk income available. It is a reasonable assumption to expect a 4% return in the fixed-income markets in 2023.
We are looking at seeing what this monstrous move in interest rates does to the US economy.
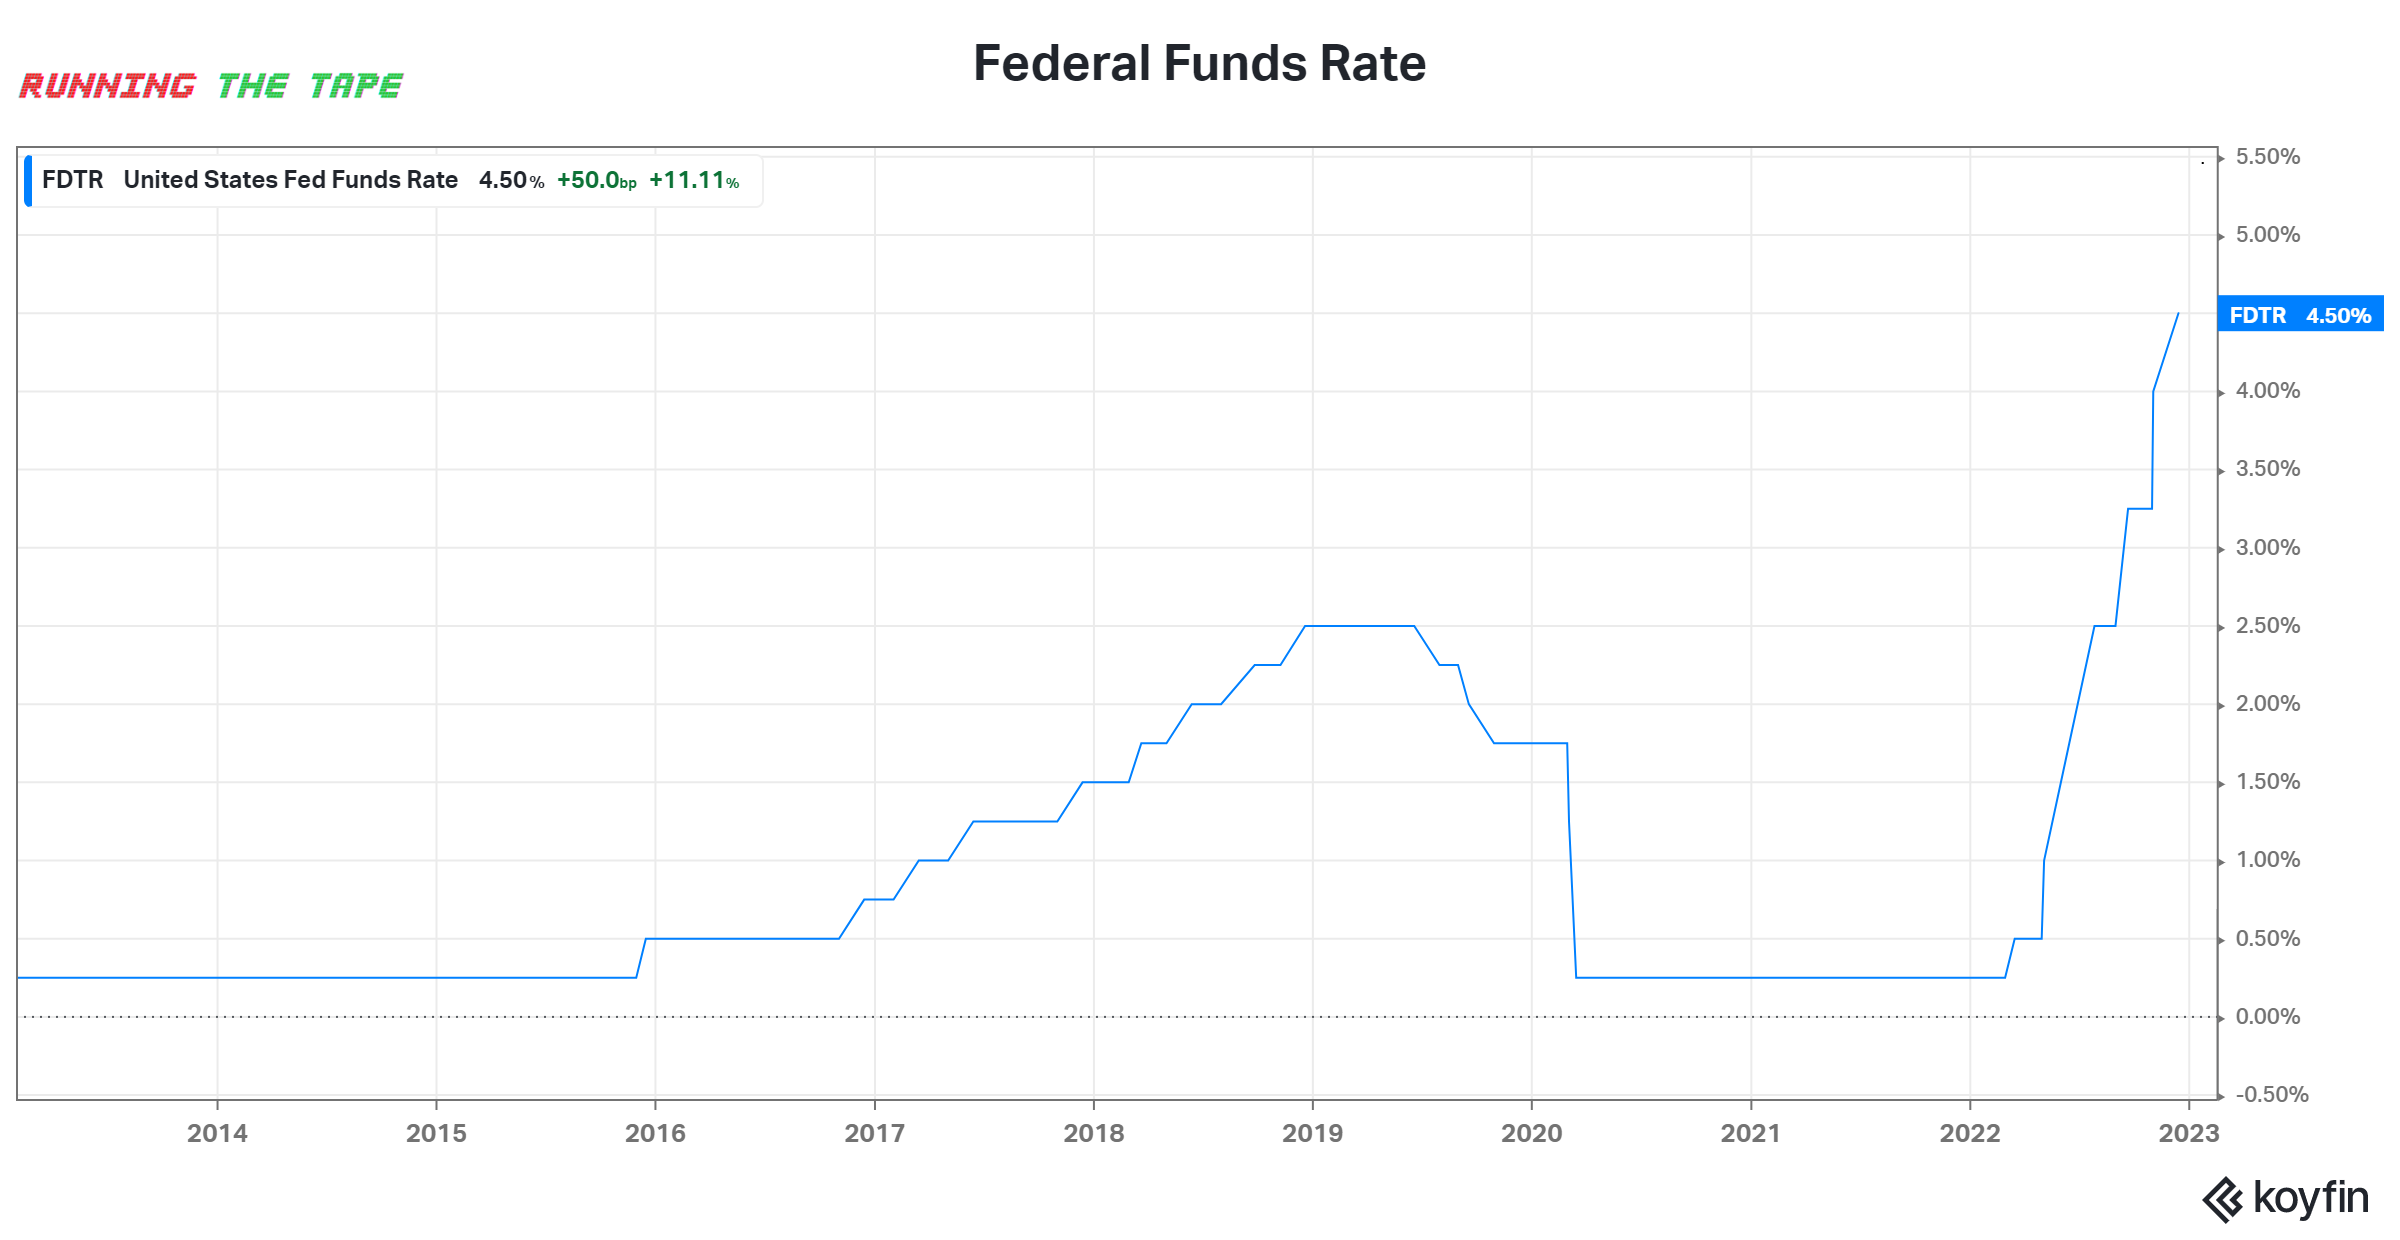
You’ll hear quite often that monetary policy works with long and variable lags. Basically, that means what the Fed does today won’t be felt until 12 months from now.
We are crossing that 12-month mark soon.
All of this is to take down inflation which is likely already cooling/cooled.

The top orange line represents the shelter component of the consumer price index (inflation). They calculate that by using data collected 6-12 months ago and asked homeowners what they would charge themselves to rent their home.
Just below that is the US home price index, which measures the average price of homes across the US, and it is also somewhat lagged as it released October data.
And lastly pending home sales are down over 35%, a decent gauge for buyer demand.
The reason this is important is shelter takes up the largest portion of the CPI and is the most lagged. The number they give you in headlines is really what the number was 6 months ago, sort of.
All of this is important because as we shift away from policy risk, the risk that the Fed does too much, to growth risk, the actual implications of the Fed’s actions, we will be narrowed in on whether or not the market has priced in better or worse cases.
If inflation cools faster and the people and businesses are stronger we could have stronger rallies, if they don’t we could have further lows.
The market doesn’t care about good or bad only better or worse.
So if you see a bad headline it doesn’t mean it’s bad for the markets unless it was worse than the market expected.
That’s what I will be looking for in the economy in 2023.
Let me know what you think about 2023 by emailing runningthetape@gmail.com.